Multiple Choice
The following diagram is a cost-volume-profit graph for a manufacturing company: Select the answer that best describes the labeled item on the diagram.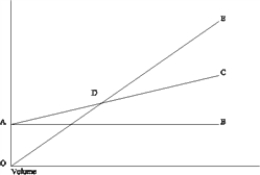
A) Area CDE represents the area of net loss.
B) Line AC graphs total fixed costs.
C) Point D represents the point at which the contribution margin per unit increases.
D) Line AC graphs total costs.
Correct Answer:

Verified
Correct Answer:
Verified
Q9: The Barnes Company manufactures two products. Information
Q10: Enola, SA., manufactures a product that sells
Q12: The Allen Company had the following income
Q13: The following data pertain to the three
Q15: Gilbert Company had the following information:<br>Required:<br> <img
Q16: The range of operations within which a
Q16: The income statement for Thomas Manufacturing Company
Q17: A "what if" technique that examines the
Q18: Total costs may be computed as follows:<br>A)
Q19: The Kringel Company provides the following information: