Multiple Choice
The following diagram is a cost-volume-profit graph for a manufacturing company: The formula to determine the Y-axis value (£) at point D on the graph is as follows: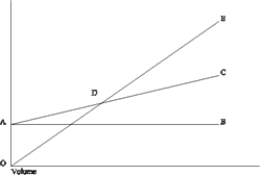
A) Fixed costs + (Variable costs per unit × Number of units)
B) ΣXY - bΣX
C) Fixed costs/Unit contribution margin
D) Fixed costs/Contribution margin ratio
Correct Answer:

Verified
Correct Answer:
Verified
Q8: As the volume of activity increases within
Q11: A profit-volume graph<br>A)measures profit or loss on
Q15: For each of the following situations, draw
Q23: Camp Gordon has annual fixed operating costs
Q24: Describe the cost-volume-profit analysis. Discuss how this
Q25: Patricia Company produces two products, X and
Q28: At a monthly volume of £25,000, a
Q29: Information about two products is as follows:
Q32: Sarah Smith, a sole proprietor, has the
Q56: A decrease in the sales price in