Multiple Choice
Figure 13-4 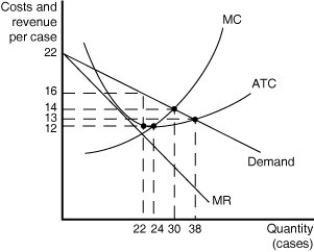 Figure 13-4 shows cost and demand curves for a monopolistically competitive producer of iced-tea.
-Refer to Figure 13-4.Based on the diagram,one can conclude that
A) some existing firms will exit the market.
B) new firms will enter the market.
C) the industry is in long-run equilibrium.
D) firms achieve productive efficiency.
Correct Answer:

Verified
Correct Answer:
Verified
Q27: Which of the following statements is true
Q93: Long-run equilibrium under monopolistic competition and perfect
Q124: Figure 13-4 <img src="https://d2lvgg3v3hfg70.cloudfront.net/TB4186/.jpg" alt="Figure 13-4
Q125: Table 13-1<br> <img src="https://d2lvgg3v3hfg70.cloudfront.net/TB4186/.jpg" alt="Table 13-1
Q135: Which of the following is not a
Q180: The most important of the factors that
Q227: Why would an organization as large as
Q235: When a firm has been granted a
Q237: Monopolistically competitive firms can differentiate their products<br>A)by
Q242: Unlike a perfectly competitive firm, a monopolistic