Multiple Choice
Table 4-4
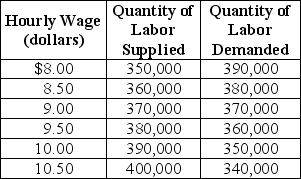 Table 4-4 shows the demand and supply schedules for the low-skilled labor market in the city of Westover.
-Refer to Table 4-4.Suppose that the quantity of labor supplied increases by 40,000 at each wage level.What are the new free market equilibrium hourly wage and the new equilibrium quantity of labor?
A) W = $9.00; Q = 410,000
B) W = $9.50; Q = 420,000
C) W = $8.50; Q = 400,000
D) W = $8.00; Q = 390,000
Correct Answer:

Verified
Correct Answer:
Verified
Q144: Figure 4-5 <img src="https://d2lvgg3v3hfg70.cloudfront.net/TB1236/.jpg" alt="Figure 4-5
Q145: Is there a difference between the "true
Q146: Figure 4-5 <img src="https://d2lvgg3v3hfg70.cloudfront.net/TB1236/.jpg" alt="Figure 4-5
Q147: Which term refers to a legally established
Q148: The total amount of consumer surplus in
Q150: Which of the following describes the difference
Q151: Figure 4-1 <img src="https://d2lvgg3v3hfg70.cloudfront.net/TB1236/.jpg" alt="Figure 4-1
Q152: A tax is imposed on employers and
Q153: Marco goes to the pet store to
Q154: Figure 4-1 <img src="https://d2lvgg3v3hfg70.cloudfront.net/TB1236/.jpg" alt="Figure 4-1