Multiple Choice
Figure 3-8 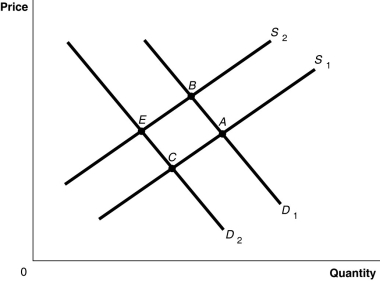
-Refer to Figure 3-8.The graph in this figure illustrates an initial competitive equilibrium in the market for motorcycles at the intersection of D2 and S2 (point
A) The equilibrium point will move from E to A.
B) The equilibrium point will move from E to B.
C) The equilibrium point will move from E to C.
D) The equilibrium point will remain at E.
E) .If the technology to produce motorcycles improves and the number of buyers increases,how will the equilibrium point change?
Correct Answer:

Verified
Correct Answer:
Verified
Q23: If the price of peaches,a substitute for
Q24: How does the increasing use of digital
Q25: The decline in the popularity of clothing
Q26: If the price of gasoline increases,what will
Q27: Electric car enthusiasts want to buy more
Q29: Assume that airline tickets are a normal
Q30: A _ demand curve for shampoo would
Q31: A decrease in input costs in the
Q32: A surplus is defined as the situation
Q33: Several studies have shown promising links between