Multiple Choice
Figure 3-8 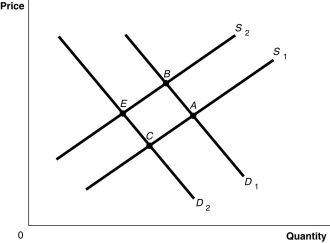
-Refer to Figure 3-8.The graph in this figure illustrates an initial competitive equilibrium in the market for motorcycles at the intersection of D1 and S2 (point B) .If there is an increase in number of companies producing motorcycles and a decrease in income (assume motorcycles are a normal good) ,the equilibrium could move to which point?
A) A
B) B
C) C
D) E
Correct Answer:

Verified
Correct Answer:
Verified
Q33: Several studies have shown promising links between
Q46: A supply curve<br>A)is a table that shows
Q50: Figure 3-4 <img src="https://d2lvgg3v3hfg70.cloudfront.net/TB1236/.jpg" alt="Figure 3-4
Q81: Figure 3-2 <img src="https://d2lvgg3v3hfg70.cloudfront.net/TB1236/.jpg" alt="Figure 3-2
Q89: All else equal,the desired increase in the
Q94: Figure 3-8 <img src="https://d2lvgg3v3hfg70.cloudfront.net/TB4189/.jpg" alt="Figure 3-8
Q96: An inferior good is a good for
Q147: Table 3-2<br> <img src="https://d2lvgg3v3hfg70.cloudfront.net/TB1236/.jpg" alt="Table 3-2
Q164: Figure 3-7 <img src="https://d2lvgg3v3hfg70.cloudfront.net/TB1236/.jpg" alt="Figure 3-7
Q169: If consumers believe the price of tablet