Multiple Choice
Figure 19-1 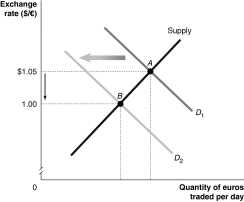
-Refer to Figure 19-1.Which of the following would cause the change depicted in the figure above?
A) U.S.productivity rises relative to European productivity.
B) Europeans decrease their preferences for U.S.goods relative to European goods.
C) The European Union increases its quotas on French wine.
D) an increase in the price level of U.S.goods relative to European goods
Correct Answer:

Verified
Correct Answer:
Verified
Q4: What determined the exchange rates among currencies
Q29: Figure 19-10 <img src="https://d2lvgg3v3hfg70.cloudfront.net/TB1236/.jpg" alt="Figure 19-10
Q59: Figure 19-10 <img src="https://d2lvgg3v3hfg70.cloudfront.net/TB1236/.jpg" alt="Figure 19-10
Q87: Figure 19-11 <img src="https://d2lvgg3v3hfg70.cloudfront.net/TB1236/.jpg" alt="Figure 19-11
Q101: Figure 19-4 <img src="https://d2lvgg3v3hfg70.cloudfront.net/TB1236/.jpg" alt="Figure 19-4
Q131: How were countries whose industries competed with
Q150: If the average productivity of American firms
Q170: Pegging a country's exchange rate to the
Q231: Managed float exchange systems were abandoned with
Q254: The "Big Mac Theory of Exchange Rates"