Multiple Choice
Figure 13-2 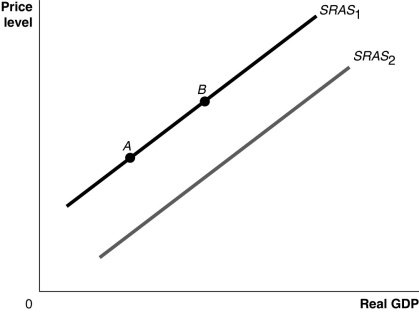
-Refer to Figure 13-2.Ceteris paribus,a decrease in productivity would be represented by a movement from
A) SRAS1 to SRAS2.
B) SRAS2 to SRAS1.
C) point A to point B.
D) point B to point A.
Correct Answer:

Verified
Correct Answer:
Verified
Q34: Figure 13-1 <img src="https://d2lvgg3v3hfg70.cloudfront.net/TB1236/.jpg" alt="Figure 13-1
Q35: The long-run aggregate supply curve<br>A)has a negative
Q36: Using the aggregate supply and demand model,illustrate
Q37: Which of the following models advocate that
Q38: In the dynamic aggregate demand and aggregate
Q40: Because of the slope(s)of the _,we can
Q41: If potential GDP is equal to $600
Q42: Why does the short-run aggregate supply curve
Q43: A decrease in aggregate demand results in
Q44: Suppose the economy is at full employment