Multiple Choice
Figure 13-4 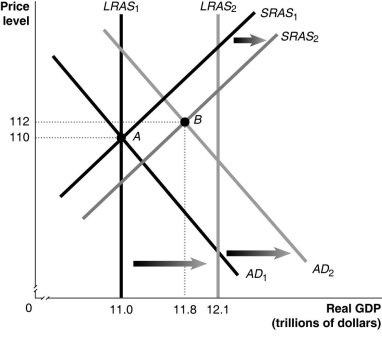
-Refer to Figure 13-4.Given the economy is at point A in year 1,what is the difference between the actual growth rate in GDP in year 2 and the potential growth rate in GDP in year 2?
A) 0.3%
B) 1.1%
C) 2.7%
D) 3.7%
Correct Answer:

Verified
Correct Answer:
Verified
Q116: Figure 13-1 <img src="https://d2lvgg3v3hfg70.cloudfront.net/TB1236/.jpg" alt="Figure 13-1
Q117: If technological change occurs in the economy<br>A)the
Q118: Stagflation occurs when<br>A)inflation rises and GDP rises.<br>B)inflation
Q119: Using an aggregate demand graph,illustrate the impact
Q120: The main belief of the monetarist model
Q122: When potential GDP increases,short-run aggregate supply also
Q123: Stagflation occurs when aggregate supply and aggregate
Q124: Workers and firms both expect that prices
Q125: Workers expect inflation to rise from 3%
Q126: Figure 13-2 <img src="https://d2lvgg3v3hfg70.cloudfront.net/TB1236/.jpg" alt="Figure 13-2