Multiple Choice
Table 10-2
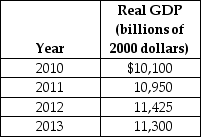
-Refer to Table 10-2.Using the table above,what is the approximate growth rate of real GDP from 2011 to 2012?
A) 1%
B) 2%
C) 3%
D) 4%
Correct Answer:

Verified
Correct Answer:
Verified
Q4: If net taxes rise by $150 billion,would
Q11: Table 10-1<br> <img src="https://d2lvgg3v3hfg70.cloudfront.net/TB4189/.jpg" alt="Table 10-1
Q26: Explain why a centrally-planned economy might not
Q39: Which of the following does not describe
Q52: The period between a business cycle peak
Q56: Economists have not found a way to
Q59: Purchases of Huggies diapers should<br>A)remain fairly constant
Q74: If government purchases are $400 million,taxes are
Q77: Figure 10-3 <img src="https://d2lvgg3v3hfg70.cloudfront.net/TB4191/.jpg" alt="Figure 10-3
Q114: Explain and show graphically how an increase