Essay
The table below uses adjusted data for the year 2000 provided by Statistics Canada.All values are in millions.Fill in the blank entries in the table. 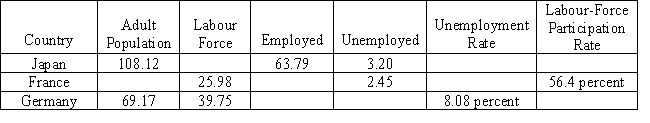
Correct Answer:

Verified
The following formulas should be applied...View Answer
Unlock this answer now
Get Access to more Verified Answers free of charge
Correct Answer:
Verified
The following formulas should be applied...
View Answer
Unlock this answer now
Get Access to more Verified Answers free of charge
Related Questions
Q17: Typically, how much more do union members
Q64: Even though the difference in labour-force participation
Q71: Suppose that consumers decide to buy more
Q72: In 2014,Mark opens up a new vehicle
Q77: In 2014 in Japan,based on concepts similar
Q107: What would be the most likely effect
Q138: What is characteristic of the relationship between
Q140: How is the labour-force participation rate computed?<br>A)
Q180: About half of all spells of unemployment
Q182: In 1914, Henry Ford began paying his