Multiple Choice
Figure 16-2 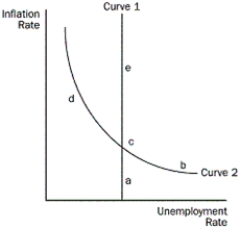
-Refer to the Figure 16-2.What is Curve 1?
A) the long-run aggregate-supply curve
B) the short-run aggregate-supply curve
C) the long-run Phillips curve
D) the short-run Phillips curve
Correct Answer:

Verified
Correct Answer:
Verified
Q35: How were inflation and unemployment from 1980
Q53: Figure 16-3 <img src="https://d2lvgg3v3hfg70.cloudfront.net/TB4801/.jpg" alt="Figure 16-3
Q58: Figure 16-4 <img src="https://d2lvgg3v3hfg70.cloudfront.net/TB4801/.jpg" alt="Figure 16-4
Q59: Figure 16-4 <img src="https://d2lvgg3v3hfg70.cloudfront.net/TB4801/.jpg" alt="Figure 16-4
Q73: If the Bank of Canada announced a
Q83: How does the short-run Phillips curve model
Q91: According to Phillips, which set of two
Q129: How was the Phillips curve for most
Q159: According to Friedman and Phelps, when is
Q188: If there is an adverse supply shock,