Multiple Choice
Figure 16-3 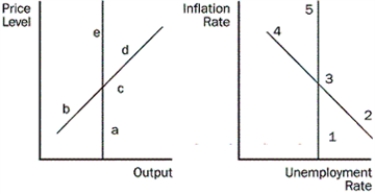
-Refer to the Figure 16-3.Starting from c and 3,where does a decrease in aggregate demand move the economy to,in the short run and the long run?
A) a and 1 in the short run,b and 2 in the long run
B) b and 2 in the short run,a and 1 in the long run
C) d and 4 in the short run,e and 5 in the long run
D) b and 4 in the short run,e and 1 in the long run
Correct Answer:

Verified
Correct Answer:
Verified
Q15: What do the data for the period
Q57: If policymakers reduce aggregate demand, what happens
Q104: According to Friedman and Phelps, when is
Q109: Figure 16-4 <img src="https://d2lvgg3v3hfg70.cloudfront.net/TB4801/.jpg" alt="Figure 16-4
Q110: What is the long-run effect of an
Q111: Figure 16-2 <img src="https://d2lvgg3v3hfg70.cloudfront.net/TB4801/.jpg" alt="Figure 16-2
Q116: Figure 16-2 <img src="https://d2lvgg3v3hfg70.cloudfront.net/TB4801/.jpg" alt="Figure 16-2
Q128: How will a favourable supply shock shift
Q141: If policymakers expand aggregate demand, what happens
Q197: In the late 1960s and early 1970s,