Multiple Choice
Figure 16-4 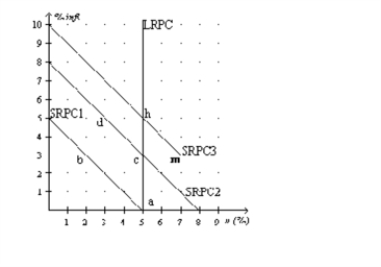
-Refer to the Figure 16-4.Along SRPC1,what is the expected rate of inflation?
A) 0 percent
B) 2 percent
C) 5 percent
D) 8 percent
Correct Answer:

Verified
Correct Answer:
Verified
Q4: In the late 1960s, which of the
Q19: Figure 16-2 <img src="https://d2lvgg3v3hfg70.cloudfront.net/TB4801/.jpg" alt="Figure 16-2
Q24: Figure 16-2 <img src="https://d2lvgg3v3hfg70.cloudfront.net/TB4801/.jpg" alt="Figure 16-2
Q25: Who releases the closely watched indicators such
Q26: Figure 16-4 <img src="https://d2lvgg3v3hfg70.cloudfront.net/TB4801/.jpg" alt="Figure 16-4
Q64: Suppose the long-run Phillips curve shifts to
Q87: Suppose that a central bank increases the
Q98: How will a favourable supply shock shift
Q134: According to the Friedman-Phelps analysis, in the
Q169: What did Friedman and Phelps argue about