Multiple Choice
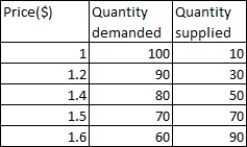
The table given below shows the quantity supplied and the quantity demanded for a good at different prices.If the price of the good described in the table given below is $1.50,then:
Table 4.1
A) there is a shortage in the market.
B) there is a surplus in the market.
C) the market is in equilibrium.
D) the supply of the good increases by 30 units.
E) the demand for the good increases by 30 units.
Correct Answer:

Verified
Correct Answer:
Verified
Q10: What is the effect of a decrease
Q10: Figure 4.5 shows the supply curves of
Q13: Which of the following is likely to
Q13: In the table given below,which of the
Q77: Which of these is likely to increase
Q96: The income effect of a decrease in
Q104: Markets tend to increase the costs of
Q105: Which of the following will lead to
Q107: If butter and margarine are substitute goods,an
Q138: As the price of milk increases,producers are