Multiple Choice
The table given below shows the quantity supplied and the quantity demanded for a good at different prices.If the price of the good described in the table below is $1.60,then an economist would expect the: Table 4.1
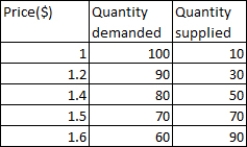
A) price to decrease to $1.40.
B) price to decrease to $1.50.
C) quantity supplied to decrease to 50 units.
D) quantity demanded to increase to 80 units.
E) quantity demanded to decrease to 50 units.
Correct Answer:

Verified
Correct Answer:
Verified
Q13: In the table given below,which of the
Q13: Which of the following is likely to
Q19: In the figure given below that shows
Q43: Rent controls generally provide the tenants the
Q75: Sugar and honey are viewed as substitutes
Q75: Which of the following is most likely
Q83: Tickets to the Michigan-Notre Dame football game
Q86: Which of these is likely to decrease
Q107: If butter and margarine are substitute goods,an
Q149: A mismatch between quantity demanded and quantity