Multiple Choice
The following table shows an aggregate demand schedule and an aggregate supply schedule.Which of the following is true?
Table 5.1
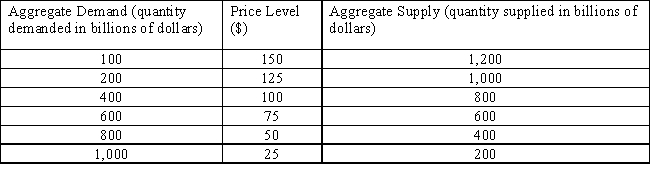
A) Equilibrium output is $1,000,and equilibrium price level is 25.
B) Equilibrium output is $800,and equilibrium price level is 50.
C) Equilibrium output is $200,and equilibrium price level is 125.
D) Equilibrium output is $400,and equilibrium price level is 25.
E) Equilibrium output is $600,and equilibrium price level is 75.
Correct Answer:

Verified
Correct Answer:
Verified
Q17: Due to the implementation of the Troubled
Q25: Identify the most likely impact of a
Q35: Which of these signifies the role of
Q50: Which of these is a central argument
Q59: A depression can be defined as:<br>A)a mild
Q88: Which of the following is true of
Q95: A recession is best defined as a
Q96: Which of these faulty economic policies was
Q107: From 2009 to 2013,the price level in
Q140: The ultimate objective of macroeconomics is to:<br>A)reduce