Multiple Choice
The figure below shows the aggregate demand and supply curves for the U.S.The figure given below shows that from the beginning of period 1 to the end of period 2:
Figure 5.1
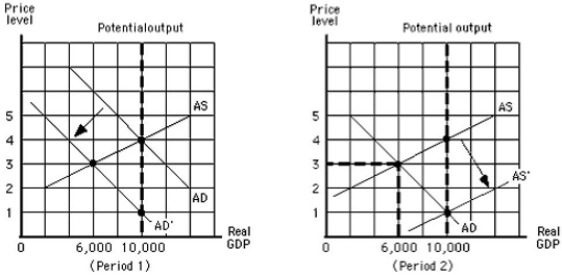
A) real GDP decreased and then increased.
B) real GDP increased and then decreased.
C) real GDP fell from $10,000 to $6,000.
D) real GDP rose from $6,000 to $10,000.
E) the inflation rate fell from 4 percent to 1 percent.
Correct Answer:

Verified
Correct Answer:
Verified
Q8: An increase in wage rate,other things constant,shifts
Q20: One explanation for the slope of the
Q44: An investment bank is a financial institution
Q60: The term stagflation refers to:<br>A)a simultaneous reduction
Q70: A federal policy that leads to an
Q71: The aggregate demand curve reflects:<br>A)a direct relationship
Q116: In terms of the aggregate demand and
Q131: A rise in the price level will:<br>A)cause
Q136: Which of the following can be concluded
Q141: An economic variable that is measured per