Multiple Choice
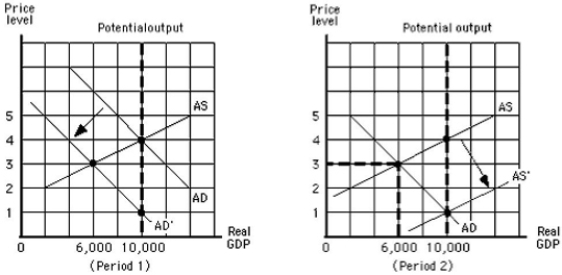
The figure below shows the aggregate demand and supply curves for the U.S.In this figure,as the aggregate demand curve shifts from AD to AD',the equilibrium price level in period 1:
Figure 5.2
A) increases from 3 to 4.
B) decreases from 4 to 3.
C) decreases from 4 to 1.
D) increases from 1 to 4.
E) decreases from 4 to 2.
Correct Answer:

Verified
Correct Answer:
Verified
Q8: An increase in wage rate,other things constant,shifts
Q28: On a graph showing the aggregate demand
Q99: Which of the following is true of
Q105: The figure below shows the aggregate demand
Q110: The aggregate supply curve of an economy:<br>A)is
Q131: A rise in the price level will:<br>A)cause
Q136: Which of the following can be concluded
Q143: The global financial panic in September 2008
Q146: Which of the following decades is known
Q150: Which of the following is true of