Multiple Choice
The table below shows the price indexes and the nominal gross domestic product (GDP) for an economy from 2001 to 2005.The real GDP _____ between 2001 and 2002.
Table 6.3
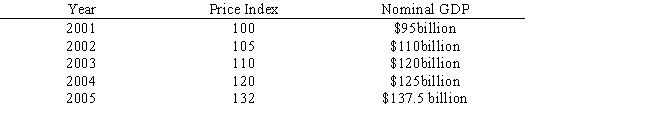
A) increased by slightly less than $10 billion
B) decreased by slightly more than $5 billion
C) remained constant
D) increased by only about $1 billion
E) increased more than $20 billion
Correct Answer:

Verified
Correct Answer:
Verified
Q19: Which of the following is an example
Q28: _ is measured in terms of current-year
Q37: Transfer payments are an injection into the
Q48: If the real gross domestic product (GDP)for
Q58: The largest component of aggregate expenditure is
Q59: The final market value of a good
Q60: If the price of a good increases
Q74: The table below shows the current and
Q77: If a toy store overestimates the demand
Q109: If the value of exports equals $6.5