Multiple Choice
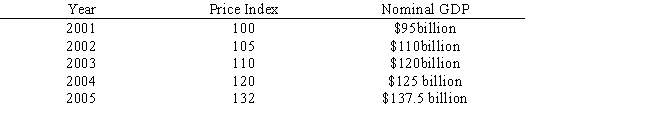
The table below shows the price indexes and the nominal gross domestic product (GDP) for an economy from 2001 to 2005.The real GDP _____ between 2002 and 2003.
Table 6.3
A) decreased by slightly more than $5 billion
B) increased by slightly more than $4 billion
C) remained constant
D) increased by only about $1 billion
E) decreased by $6 billion
Correct Answer:

Verified
Correct Answer:
Verified
Q1: Lois sells ten sweaters she had knitted
Q2: One of the limitations of the national
Q24: The statement "Gross domestic product (GDP)values all
Q61: The Consumer Price Index (CPI)is a measure
Q69: When calculating gross domestic product (GDP),double counting
Q72: Which of the following would be excluded
Q82: Real gross domestic product (GDP)shows:<br>A)total spending on
Q116: Rhonda sells a house she has owned
Q117: Which of the following would be included
Q132: In order to convert nominal gross domestic