Multiple Choice
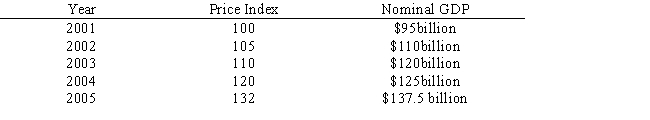
The table below shows the price indexes and the nominal gross domestic product (GDP) for an economy from 2001 to 2005.The real GDP _____ between 2002 and 2005.
Table 6.3
A) increased more than $5 billion
B) decreased more than $5 billion
C) increased by less than $1 billion
D) decreased by less than $1 billion
E) remained constant
Correct Answer:

Verified
Correct Answer:
Verified
Q23: The value added method to measure GDP
Q34: The base year for a price index
Q41: A decrease in gross domestic product (GDP)necessarily
Q44: Katrina pays $40 for a meal at
Q86: A GDP price index of 100 for
Q87: Leakages cause diversion of income from the
Q88: Which of the following is true of
Q100: The consumer price index (CPI)tends to understate
Q103: The table below shows the price indexes
Q128: Imports are leakages from the circular flow