Multiple Choice
The following image shows the aggregate demand and aggregate supply curves of an economy.In the graph below,the rise in the price levels from P1 to P2 is a result of:
Figure 7.1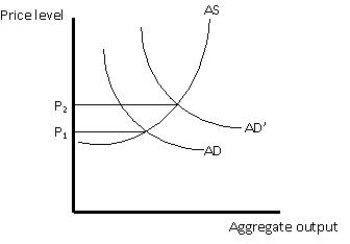
A) cost-pull inflation.
B) cost-push inflation.
C) demand-push inflation.
D) demand-pull inflation.
E) induced inflation.
Correct Answer:

Verified
Correct Answer:
Verified
Q14: If the official unemployment rate increases from
Q28: Inflation can be caused:<br>A)only by increases in
Q41: An increase in the interest rate,other things
Q80: Suppose the total population of an economy
Q103: The official unemployment rate would be higher
Q115: Which of the following is likely to
Q137: The unemployment rate rises any time there
Q140: People who are not currently employed but
Q141: Unanticipated inflation penalizes:<br>A)those who are saving.<br>B)those who
Q146: Not counting _ as unemployed understates unemployment.<br>A)children<br>B)retired