Multiple Choice
The table given below shows the values of different components of aggregate expenditure of an economy.The equilibrium level of gross domestic product (GDP) is _____.
Table 9.2
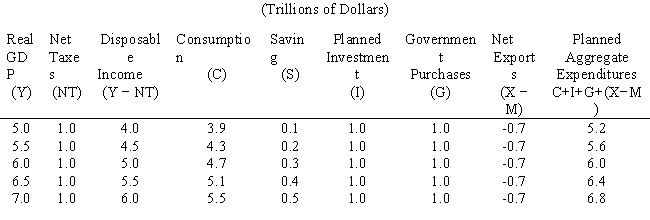
A) $5.0 trillion
B) $5.5 trillion
C) $6.0 trillion
D) $6.5 trillion
E) $7.0 trillion
Correct Answer:

Verified
Correct Answer:
Verified
Q4: Which of the following is an effect
Q43: The slope of the consumption function shows
Q45: If consumption is greater than income,saving must
Q56: As disposable income decreases,saving decreases.
Q61: The larger the marginal propensity to save,other
Q64: If a household's income falls from $26,000
Q120: Movement along the aggregate expenditure line is
Q130: Which of the following is illustrated by
Q136: The smaller the marginal propensity to save,other
Q150: Which of the following will shift the