Multiple Choice
The figure given below shows the income-expenditure model.Which of the following best describes the situation at point B?
Figure 9.1
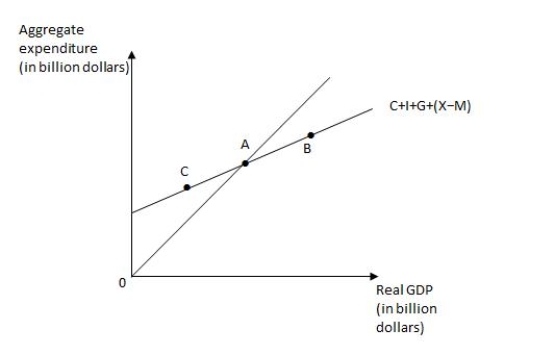
A) Consumption expenditure exceeds disposable income
B) Real GDP exceeds aggregate expenditure
C) Aggregate expenditure is exactly equal to real GDP
D) Aggregate expenditure exceeds real GDP
E) Producers experience an unexpected accumulation of inventory
Correct Answer:

Verified
Correct Answer:
Verified
Q37: If the price level in an economy
Q67: If there are no unintended changes in
Q95: If the marginal propensity to consume (MPC)in
Q96: If the simple spending multiplier is 8,the
Q101: The main determinants of investment are the
Q129: The slope of the consumption function equals
Q131: If a household's income falls from $20,000
Q143: A decrease in net wealth will _.<br>A)shift
Q144: The table given below shows the real
Q147: Expectations that the price level will increase