Multiple Choice
The figure below shows the short-run aggregate demand and supply curves of an economy.When real GDP is at Y2,_____.
Figure 10.2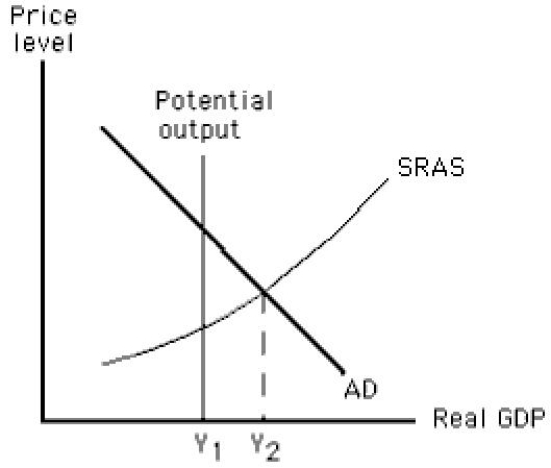
A) potential output is greater than actual output.
B) there is a recessionary gap.
C) the price level is likely to fall.
D) the actual unemployment rate is less than the natural rate of unemployment.
E) aggregate demand is likely to increase to restore equilibrium.
Correct Answer:

Verified
Correct Answer:
Verified
Q7: If nominal wage rates increase by 5
Q14: The short run is a period of
Q33: The short-run aggregate supply curve:<br>A)is positively sloped.<br>B)is
Q38: The slope of the short-run aggregate supply
Q59: Which of the following if true would
Q66: Suppose the real wage of a worker
Q85: If global pollution causes climatic changes that
Q111: When the economy produces its potential output,_
Q127: A recessionary gap is usually closed in
Q143: If resource prices are flexible,the long-run aggregate