Multiple Choice
The figure below shows equilibrium in an aggregate demand-aggregate supply model.Which of these situations will be experienced by the economy as it moves from point e to point e'?
Figure 10.3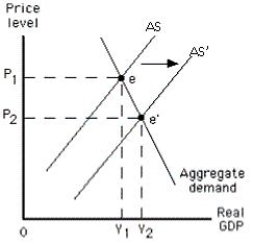
A) An expansionary gap
B) A decline in potential GDP
C) Overutilization of resources
D) Deflation
E) Cost-push inflation
Correct Answer:

Verified
Correct Answer:
Verified
Q32: Given the aggregate demand curve,an increase in
Q44: An adverse supply shock would shift:<br>A)only the
Q49: An adverse supply shock generally decreases the
Q50: During a particular year,nominal wages increased by
Q72: The figure below shows equilibrium in an
Q79: Which of the following supply shocks would
Q82: When resource prices are negotiable,the long-run aggregate
Q99: As actual output falls below the potential
Q119: If the price level in an economy
Q130: Cyclical unemployment in an economy will be