Multiple Choice
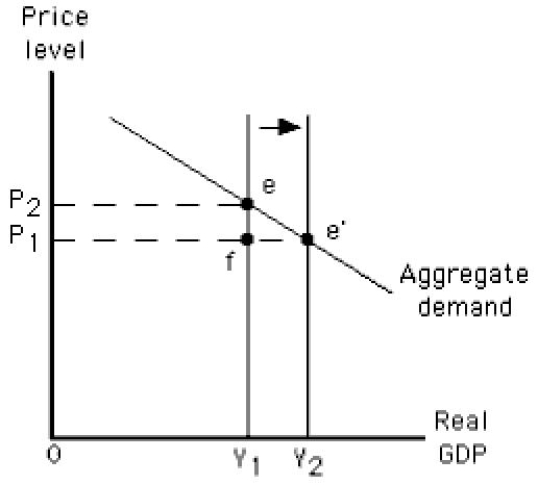
The figure given below depicts long run equilibrium in an aggregate demand-aggregate supply model.Which of the following is indicated by the arrow given in this figure?
Figure 10.8
A) A decrease in capital stock
B) An increase in long-run aggregate supply
C) An increase in nominal wage
D) A decrease in long-run aggregate supply
E) A decrease in the aggregate quantity demanded
Correct Answer:

Verified
Correct Answer:
Verified
Q4: Workers usually negotiate compensation in terms of
Q41: In the short run,there is a positive
Q57: If the price level increases by 5
Q67: In constructing a short-run aggregate supply curve,we
Q84: If the price level in the current
Q93: Which of these is most likely to
Q98: In the long run,the price level is
Q121: The natural rate of unemployment includes frictional,cyclical,and
Q124: Which of the following is true in
Q128: The more the short-run output exceeds an