Multiple Choice
The figure given below depicts long run equilibrium in an aggregate demand-aggregate supply model.The change in real GDP in this figure from Y1 to Y2 could have been caused by:
Figure 10.8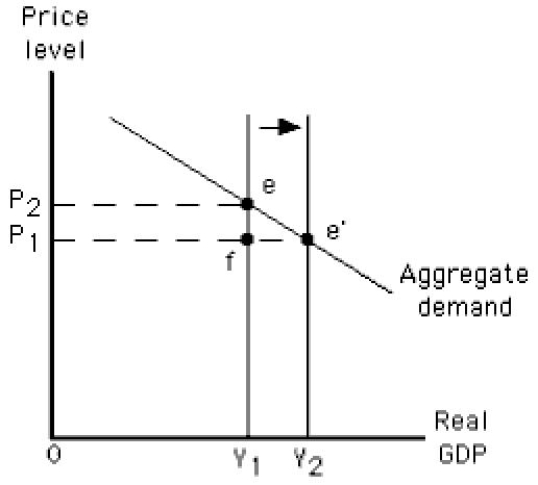
A) a government policy aimed at increasing demand.
B) a change in weather conditions that led to worldwide crop failures.
C) an attempt by key resource producers to monopolize supply.
D) an increase in taxation or a decrease in government spending.
E) an increase in labor productivity.
Correct Answer:

Verified
Correct Answer:
Verified
Q1: Which of the following is true of
Q21: For the aggregate demand and aggregate supply
Q37: An expansionary gap in the short-run results
Q65: In 2009,actual output in the U.S.was 4.7
Q76: The main effect of a decrease in
Q88: Given implicit or explicit resource price agreements,if
Q105: The rate at which aggregate supply changes
Q135: In constructing the short-run aggregate supply curve,we
Q138: Which of the following is true in
Q145: The main effect of an increase in