Multiple Choice
The figure given below shows equilibrium in a money market.If S is the initial supply curve,the movement from S to S* can be attributed to: Figure 152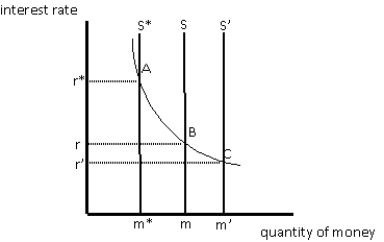
A) a decrease in the required reserve ratio.
B) the purchase of U.S.Treasury securities by the Fed.
C) the sale of U.S.Treasury securities by the Fed.
D) a decrease in the discount rate.
E) a decrease in excess reserves in the banking system.
Correct Answer:

Verified
Correct Answer:
Verified
Q6: According to the equation of exchange,if real
Q13: For a given shift of the aggregate
Q15: In the long run,an expansionary monetary policy
Q25: Which of these is a flow variable?<br>A)Money<br>B)Income<br>C)Jewelry<br>D)Bank
Q38: The demand curve for investment depicts:<br>A)an inverse
Q49: Which of the following identities describe the
Q88: The quantity theory of money states that
Q110: Which of the following is true of
Q126: If the money supply in an economy
Q144: As a result of an expansionary monetary