Multiple Choice
The figure given below depicts short-run equilibrium in an aggregate demand-aggregate supply model.If the economy is at point "e" in the short run,which of these policies adopted by the Fed is likely to return it to long-run equilibrium?
Figure 15.3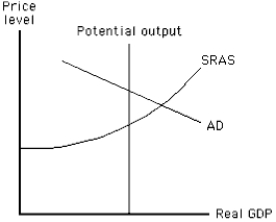
A) A decrease in government spending
B) An increase in the tax rate
C) A decrease in the tax rate
D) A decrease in the money supply
E) An increase in the money supply
Correct Answer:

Verified
Correct Answer:
Verified
Q16: Most policy makers agree that in the
Q17: Before 2008,money market mutual funds and hedge
Q30: The behavior of the M1 velocity of
Q50: If the short-run aggregate supply curve is
Q51: Which of the following changes is most
Q80: A movement upward and to the left
Q118: When the Fed is targeting the money
Q119: In the long run,if the money supply
Q132: When the short-run aggregate supply curve is
Q142: The velocity of money in circulation measures:<br>A)the