Multiple Choice
The figure given below shows short run and long run equilibrium in an aggregate demand-aggregate supply model.The economy shown in this figure is:
Figure 15.5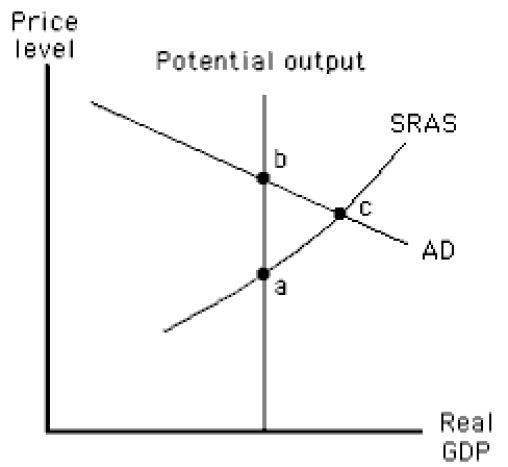
A) in a long-run equilibrium at the price level P and income level Y.
B) in a short-run equilibrium at the price level P and income level Y.
C) experiencing a contractionary gap at price level P and income level Y.
D) experiencing an expansionary gap at price level P" and income level Y'.
E) in a short-run equilibrium at the price level P' and income level Y.
Correct Answer:

Verified
Correct Answer:
Verified
Q7: An increase in aggregate demand will have
Q29: The opportunity cost of holding money is
Q61: The supply of money is depicted as
Q62: When the Fed purchases U.S.government securities through
Q89: An identity is a relationship expressed in
Q100: An increase in the money supply leads
Q114: In the money market,an increase in money
Q123: In an economy in which velocity is
Q137: The quantity theory of money assumes that
Q139: Other things constant,the quantity of money demanded