Multiple Choice
The figure below shows the relationship between an economy's potential output,price level,and real GDP.According to those who favor a passive approach to policy,the economy will attain equilibrium at potential output when:
Figure 16.1
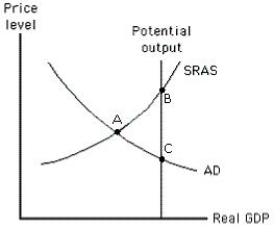
A) the short-run aggregate supply curve shifts to the left.
B) the short-run aggregate supply curve shifts to the right due to a fall in real wages.
C) either the money supply or government spending is increased.
D) either the money supply or government spending is decreased.
E) aggregate demand is decreased.
Correct Answer:

Verified
Correct Answer:
Verified
Q4: Ms.Jones is a professor at a university.She
Q53: The figure below shows the relationship between
Q60: Contrary to what the Phillips curve would
Q73: When self-correction works to eliminate an expansionary
Q92: One of the reasons fiscal and monetary
Q98: Suppose the Fed announced a policy of
Q108: Long time lags hamper the effectiveness of
Q119: The short-run Phillips curve is based upon
Q121: The short-run Phillips curve shows that:<br>A)the economy
Q139: In the early 1960s,the discovery of the