Multiple Choice
The figure below shows the price level,real GDP,and the potential output for an economy.According to those who favor a passive approach to policy,the economy will attain equilibrium at potential output when:
Figure 16-2
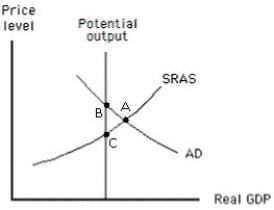
A) the SRAS curve will shift to the left.
B) the SRAS curve will shift to the right.
C) either the money supply or government spending is increased.
D) the money supply is decreased.
E) aggregate demand will decrease.
Correct Answer:

Verified
Correct Answer:
Verified
Q19: Which of the following is not a
Q29: During the period _,the short-run Phillips curve
Q32: Some economists believe that in the long
Q34: In the event of a recession,which of
Q83: Current thinking on the Phillips curve suggests
Q110: Those who prefer a passive approach to
Q113: The time required _ is not a
Q115: The short-run Phillips curve shows that as
Q117: Both those who favor an active approach
Q125: During inflation,the optimal discretionary fiscal policy would