Multiple Choice
The figure below shows the price level,real GDP,and the potential output for an economy.According to those who favor an active approach to policy,once the expansionary gap is eliminated,the economy can attain equilibrium at:
Figure 16.2
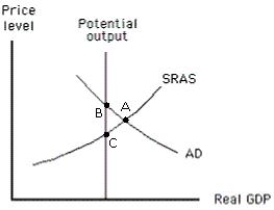
A) point A.
B) point B.
C) point C.
D) a point above point A on the SRAS curve.
E) at a point below point C on the SRAS curve.
Correct Answer:

Verified
Correct Answer:
Verified
Q15: Only long-run changes in output can be
Q40: If we observe an economy adjusting to
Q51: Policy makers may not know that the
Q56: The long-run Phillips curve is located at
Q58: According to the rational expectations school,when the
Q61: Economists of the rational expectations school believe
Q76: The wage rate considered acceptable to workers
Q89: The government of Montesia had announced that
Q94: Suppose a recession surprises economic forecasters who
Q100: The rational expectations school advocates the passive