Multiple Choice
The following graph shows the demand for and domestic supply of a good in a country.If the country decides to trade,then at a world price of $1.00 _____.
Figure 17.2
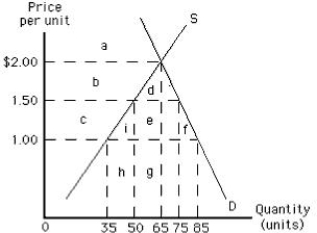
A) 20 units will be exported
B) 20 units will be imported
C) 50 units will be exported
D) 50 units will be imported
E) 10 units will be exported
Correct Answer:

Verified
Correct Answer:
Verified
Q7: The cost of the resources used by
Q13: The terms of trade refers to:<br>A)the quantity
Q19: A legal limit on the amount of
Q21: International trade is most likely to occur
Q28: The United States is a major exporter
Q30: Tariffs and quotas:<br>A)reduce consumer surplus and increase
Q37: If wage rates are lower in Mexico
Q105: Which of the following is not an
Q119: The production possibilities curve of a country
Q132: A charge levied on imports in terms