Multiple Choice
The following graph shows U.S.demand for and domestic supply of a good.Suppose the world price of the good is $1.00 per unit and a specific tariff of $0.50 per unit is imposed on each unit of imported good.In such a case,_____.
Figure 17.2
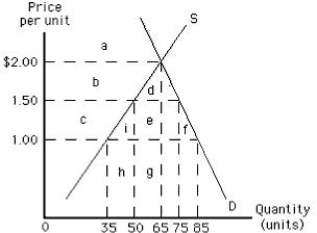
A) 25 units will be exported
B) 25 units will be imported
C) 50 units will be exported
D) 50 units will be imported
E) 10 units will be exported
Correct Answer:

Verified
Correct Answer:
Verified
Q19: A legal limit on the amount of
Q21: International trade is most likely to occur
Q30: Tariffs and quotas:<br>A)reduce consumer surplus and increase
Q37: For each pound of blueberry cheesecake Abura
Q37: If wage rates are lower in Mexico
Q44: The basis of the benefits of specialization
Q65: Relative to quotas,tariffs lead to a greater
Q89: Tariffs and quotas are the only two
Q132: A charge levied on imports in terms
Q137: According to some economists,the protection granted to