Multiple Choice
From the graph given below,identify the sales revenue line. 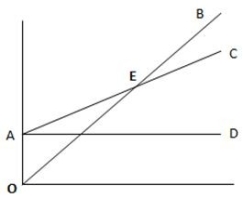
A) OB
B) AC
C) AD
D) AE
Correct Answer:

Verified
Correct Answer:
Verified
Related Questions
Q1: Contribution margin is the amount that contributes
Q5: Sensitivity analysis empowers managers with better information
Q110: Contribution margin is the difference between net
Q113: Total variable costs change in direct proportion
Q133: When all the units produced are sold,the
Q171: In its first year of business,Greenlam,Inc.produced 600
Q174: Which of the following statements is true
Q177: During the current year,Albee Company incurred $7,000
Q178: Frittata,Inc.started the year with 200 units in
Q208: Sensitivity analysis allows managers to see how