Multiple Choice
In the graph below,the area between the lines AC and OB after point 'E' represents ________. 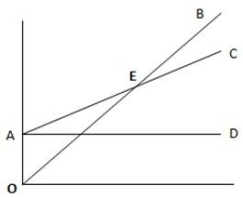
A) fixed costs
B) breakeven point
C) operating loss
D) operating income
Correct Answer:

Verified
Correct Answer:
Verified
Related Questions
Q28: When the variable cost per unit increases,the
Q82: Miranda was reviewing the water bill for
Q84: Americana Replics is owned and operated
Q86: Keys Spas,Inc.reports the following information for
Q88: The following data has been provided
Q90: Which of the following will lower the
Q94: If the volume of activity doubles in
Q99: The traditional income statement format calculates operating
Q119: Following GAAP,the income statement issued to investors
Q120: Which of the following will appear as