Multiple Choice
From the graph given below,identify the sales revenue line. 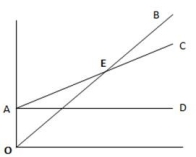
A) OB
B) AC
C) AD
D) AE
Correct Answer:

Verified
Correct Answer:
Verified
Related Questions
Q268: The breakeven point is the point where
Q269: A planning tool that expresses the relationships
Q270: The phone bill for a company
Q271: Unit product cost calculations using absorption costing
Q272: The breakeven point represents the sales level
Q274: In its first year of business,Lakota,Inc.produced 600
Q275: Complete the statement,using the following terms: increases,decreases,or
Q276: Sunlight Design Corporation sells glass vases at
Q277: When the sales price per unit decreases,the
Q278: Period costs under the variable costing method