Multiple Choice
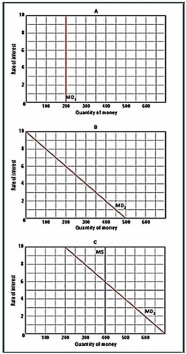
-In the figure above,what does curve MD2 represent?
A) The asset demand for money.
B) The transactions demand for money.
C) The investment demand.
D) The stock of money.
E) The total demand for money.
Correct Answer:

Verified
Correct Answer:
Verified
Related Questions
Q29: All of the following except one are
Q30: An example of quantitative easing is when:<br>A)central
Q31: The quantity of asset demand for money
Q32: What is the Bank of Canada?<br>A)A state-owned
Q33: Write out the equation of exchange,and identify
Q35: What is the price of money?
Q36: To which function of money is the
Q37: According to the equation of exchange,if V
Q38: How is the equilibrium rate of interest
Q39: An interest rate above equilibrium will lead