Multiple Choice
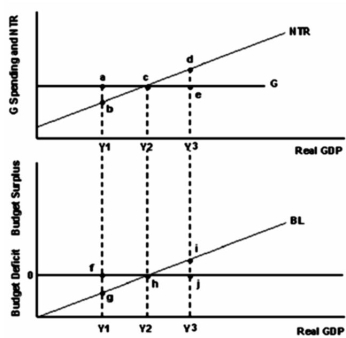
-Refer to the graph above to answer this question.What does this graph indicate?
A) That government spending is autonomous of real GDP and that net tax revenue is a function of real GDP.
B) That government spending is a function of real GDP and that net tax revenue is autonomous of real GDP.
C) That budget surpluses are possible only at lower levels of real GDP.
D) That budget deficits are possible only at higher levels of real GDP.
E) That a balanced budget can occur at any level of real GDP except Y2.
Correct Answer:

Verified
Correct Answer:
Verified
Q44: Since the end of World War II,what
Q45: Suppose that counter-cyclical fiscal policy pushed up
Q46: Which of the following would help reduce
Q47: What would be appropriate government action to
Q48: Assume that the economy is in a
Q50: Below is some information about the state
Q51: What is fiscal policy?<br>A)It is the government's
Q52: In trying to cure a recession,counter-cyclical fiscal
Q53: Suppose an economy is operating below Potential
Q54: Which of the following is a potential