Multiple Choice
Assume that the present price level is P1.
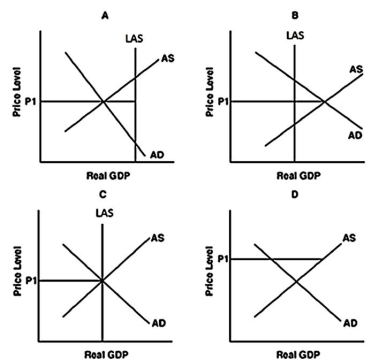
-Refer to the above graph to answer this question.Which graph illustrates a surplus of goods and services?
A) A
B) B
C) C
D) D
Correct Answer:

Verified
Correct Answer:
Verified
Related Questions
Q82: Which of the following is true?<br>A)A recessionary
Q83: How will the age of the existing
Q84: What is an inflationary gap?<br>A)The difference between
Q85: All of the following,except one,will cause an
Q86: When does macroeconomic equilibrium occur?<br>A)When exports equal
Q88: Which of the following is true of
Q89: All of the following,except one,will cause an
Q90: What does the term aggregate supply mean?
Q91: Why is the aggregate supply curve upward
Q92: What factors can cause an increase in