Multiple Choice
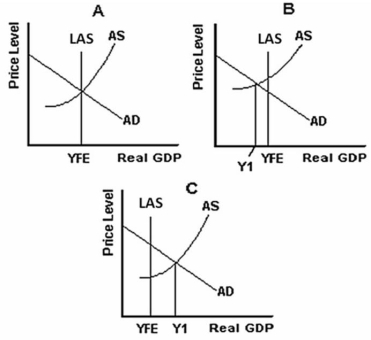
-Refer to the graph above to answer this question.What does Figure B illustrate?
A) The situation that existed in the 1930s.
B) Full-employment equilibrium.
C) An inflationary gap situation.
D) The situation that existed during World War II.
E) A situation where individual firms cannot be making profits.
Correct Answer:

Verified
Correct Answer:
Verified
Q76: Suppose that the economy of Umbria is
Q77: <img src="https://d2lvgg3v3hfg70.cloudfront.net/TB1338/.jpg" alt=" -If at a
Q78: Why is the AS curve upward-sloping?<br>A)Because firms
Q79: All of the following,except one,will cause a
Q80: What could cause the level of Real
Q82: Which of the following is true?<br>A)A recessionary
Q83: How will the age of the existing
Q84: What is an inflationary gap?<br>A)The difference between
Q85: All of the following,except one,will cause an
Q86: When does macroeconomic equilibrium occur?<br>A)When exports equal