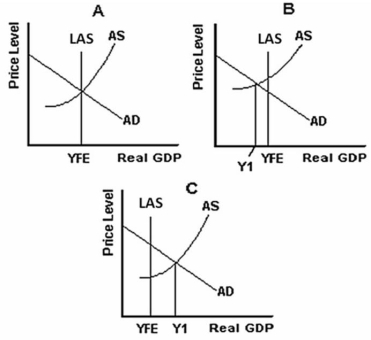
Multiple Choice

-Refer to the graph above to answer this question.What does Figure C illustrate?
A) The situation that existed in the 1930s.
B) Full-employment equilibrium.
C) An inflationary gap situation.
D) A recessionary gap situation.
E) A situation where individual firms cannot be making profits.
Correct Answer:

Verified
Correct Answer:
Verified
Q123: The following are an aggregate demand and
Q124: Under what circumstances will the multiplier effect
Q125: According to Keynesian economists,why are prices and
Q126: A change in resource prices will shift
Q127: Which of the following will lead to
Q129: What does the interest-rate effect explain?<br>A)The shape
Q130: According to neoclassicists,an increase in aggregate demand
Q131: What is the business cycle?<br>A)The expansionary and
Q132: What is true of a movement up
Q133: What could cause the aggregate demand curve