Multiple Choice
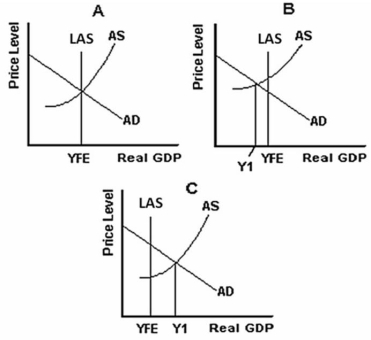
-Refer to the graph above to answer this question.What does Figure A illustrate?
A) The situation that Keynes felt existed in the 1930s.
B) Full-employment equilibrium.
C) An inflationary gap situation.
D) A situation of unstable prices.
E) A situation where individual firms cannot be making profits.
Correct Answer:

Verified
Correct Answer:
Verified
Q88: Which of the following is true of
Q89: All of the following,except one,will cause an
Q90: What does the term aggregate supply mean?
Q91: Why is the aggregate supply curve upward
Q92: What factors can cause an increase in
Q94: What does it mean to say that
Q95: Since the AS curve is upward sloping,as
Q96: What are the four components of aggregate
Q97: Why are the interest-rate,foreign-trade and real balances
Q98: Assume that the present price level is