Multiple Choice
Below is a production possibilities curve involving tea and videos.
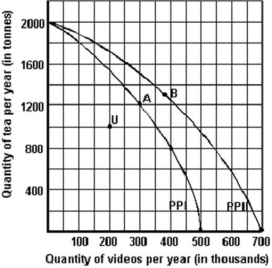
-Refer to the graph above to answer this question.What could have caused the shift from PPI to PPII?
A) A decrease in the price of videos.
B) Capital accumulation in the tea industry.
C) A decrease in the opportunity cost of tea.
D) Technological change in the video industry.
Correct Answer:

Verified
Correct Answer:
Verified
Q147: Below is a production possibilities curve involving
Q148: The maximum production possible in Rome and
Q149: All of the following statements,except one,are positive
Q150: Which of the following is a consumer
Q151: Technological improvement can be illustrated graphically by
Q152: Below are some production possibilities data for
Q153: Which of the following statements describes the
Q154: Below are some production possibilities data for
Q156: In general,how to produce depends most on
Q157: Refer to the table above to answer