Multiple Choice
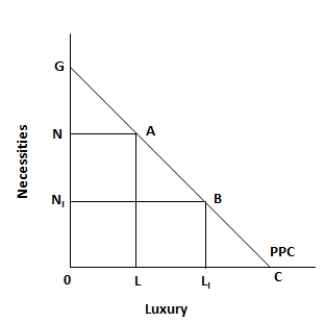
Figure 5.1. The figure shows a linear production possibility curve representing a tradeoff faced by a country, between necessities and luxuries. 
-Refer to figure 5.1. Under which of the following conditions, would the residents of the country choose to consume luxury goods?
A) When there is an increase in the price of luxury goods
B) When there is a decrease in the prices of inferior goods
C) When there is an increase in the prices of goods that are necessities
D) When there is an increase in the per capita income of households
E) When there is a decrease in the per capita income of households
Correct Answer:

Verified
Correct Answer:
Verified
Q25: Figure 5.2. The figure shows the supply
Q26: Figure 5.1. The figure shows a linear
Q27: Scenario 4-1<br>In a given year, country A
Q28: Scenario 4-1<br>In a given year, country A
Q29: Figure 5.3. The figure shows the wage
Q31: Figure 5.3. The figure shows the wage
Q32: Figure 5.2. The figure shows the supply
Q33: Figure 5.3. The figure shows the wage
Q34: Scenario 4-1<br>In a given year, country A
Q35: Figure 5.2. The figure shows the supply