Multiple Choice
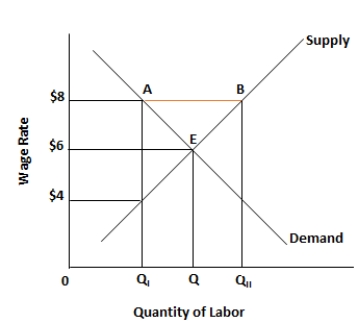
Figure 5.3. The figure shows the wage rate and the quantity of labor supplied in an unskilled labor market. 
-Which of the following is explained by the price elasticity of demand for a product?
A) The effect of changes in price on the supply of the product
B) The effect of changes in quantity on the supply of the product
C) The effect of changes in quantity on the price of the product
D) The effect of changes in price on the quantity demanded of the product
E) The effect of changes in price on the quantity supplied of the product
Correct Answer:

Verified
Correct Answer:
Verified
Q62: The figure given below shows the demand
Q63: Scenario 5.1<br>The demand for noodles is given
Q64: The figure given below shows the demand
Q65: The figure given below shows the demand
Q66: The figure given below shows the demand
Q68: The table below shows the quantities of
Q69: Figure 5.3. The figure shows the wage
Q70: The figure given below shows the demand
Q71: The figure given below shows the demand
Q72: Scenario 5.1<br>The demand for noodles is given