Multiple Choice
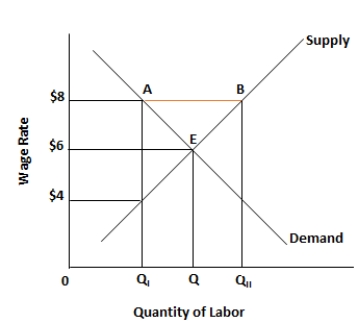
Figure 5.3. The figure shows the wage rate and the quantity of labor supplied in an unskilled labor market. 
-When the elasticity of demand for a particular good is between zero and -1, _____.
A) demand is elastic
B) demand is inelastic
C) demand is unit-elastic
D) the good is an inferior good
E) the good is a normal good
Correct Answer:

Verified
Correct Answer:
Verified
Q50: The figure given below shows the demand
Q51: Scenario 5.1<br>The demand for noodles is given
Q52: The figure given below shows the demand
Q53: Scenario 5.1<br>The demand for noodles is given
Q54: The figure given below shows the demand
Q56: Figure 5.3. The figure shows the wage
Q57: Figure 5.3. The figure shows the wage
Q58: The figure given below shows the demand
Q59: The figure given below shows the demand
Q60: The figure given below shows the demand